4 What is Geographic Data?
This chapter will introduce geographic data, where it comes from, and how it is produced.
4.1 Defining Geographic Data and Information
Geographic data is data that can be tied to a specific location on Earth. In general, geographic data includes both location and attribute components. The location tells us where a feature is in the world and must be represented using a coordinate system, which provides a standardized way of expressing position on the Earth’s surface (hello Cartesian logic!), to be analyzed in a GIS. The attributes provide additional information about what exists or occurs at that location. Geographic data can be stored in a variety of formats, which will be explored in greater detail in Chapter 5, and can represent both physical and human features, such as rivers, roads, buildings, vegetation, population density, pollution levels, or disease clusters. In particular, GIS is used to turn data into information. “Raw” data must be processed, analyzed, and contextualized to become information.
Data quality is the foundation of any successful analysis. To produce meaningful results, the data you use must be temporally suitable, appropriately detailed, and relevant to your spatial question. If the resolution is too coarse, the data outdated, or the attributes inaccurate, your analysis will be compromised. As the saying goes, “Garbage in, garbage out”- the quality of your output is only as good as the quality of your input.
4.2 Where does geographic data come from?
Historically, geospatial data was collected almost exclusively by state institutions, militaries, and professional surveyors. These data sources were considered “authoritative” because they relied on credentialed experts, standardized tools, and formal methodologies to achieve a high degree of accuracy. Early data collection involved resource-intensive methods like land surveying (using total stations and reference points), aerial photography for photogrammetry, remote sensing, and field data collection during censuses. The tools were expensive, slow, and required specialized training, but they produced high-quality data with thorough documentation (metadata). At the same time, they necessarily represented and re-created the priorities of those funding its acquisition.
Some of the common sources of “authoritative” spatial data include:
- US Census Bureau
- Population counts and demographics (e.g., race, age, income)
- Housing and economic data
- Geographic boundaries (e.g., census tracts, block groups, ZIP code tabulation areas)
- US Geological Survey (USGS)
- Topographic maps
- Elevation and terrain (e.g., DEMs)
- Land cover and land use (e.g., NLCD)
- Hydrography (rivers, lakes, watersheds)
- Geologic and seismic data
- NASA
- Weather and climate data
- Coastal and marine mapping (e.g., nautical charts, sea surface temperature)
- Flood zones and storm surge models
- Fisheries and oceanographic data
- State and Local Governments
- Parcel and zoning data
- Transportation networks (roads, transit routes)
- Utilities and infrastructure (e.g., water lines, sewer systems)
- Land use plans and municipal boundaries
- EPA
- Air and water quality data
- Environmental justice mapping (e.g., EJScreen)
- Regulated facility locations
4.3 How is geographic data collected?
4.3.1 Remote sensing
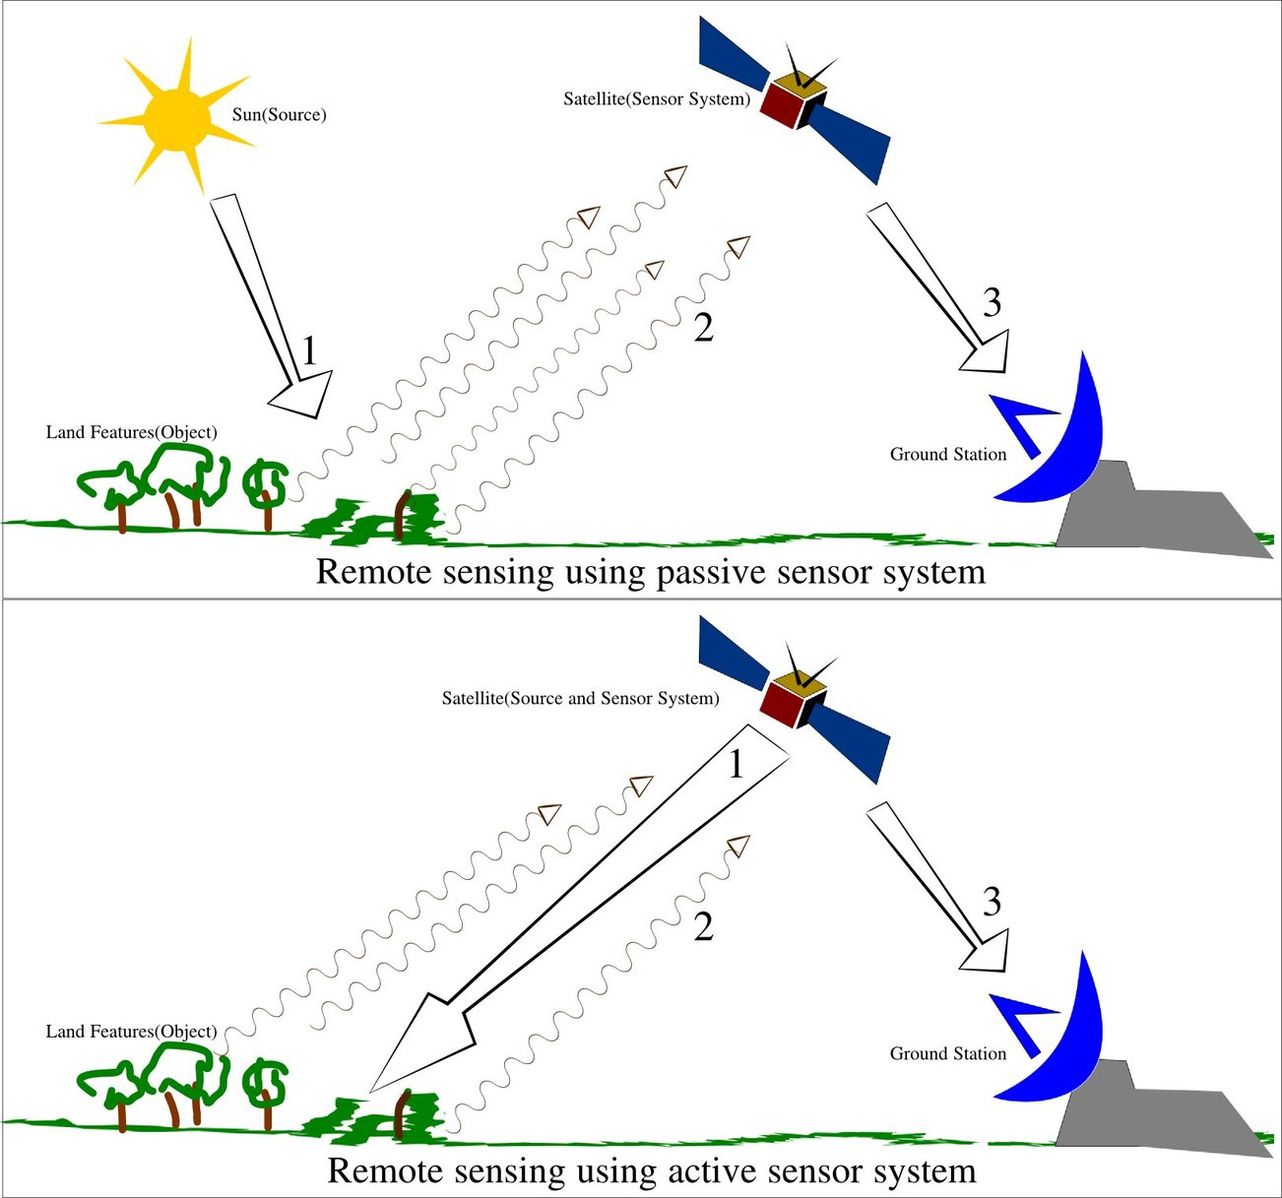
Uses satellites or aircraft to capture reflected or emitted energy from the Earth’s surface. Because different surfaces reflect energy at different wavelengths, this method can be used to identify and classify surfaces on earth.
4.3.2 Land Surveys
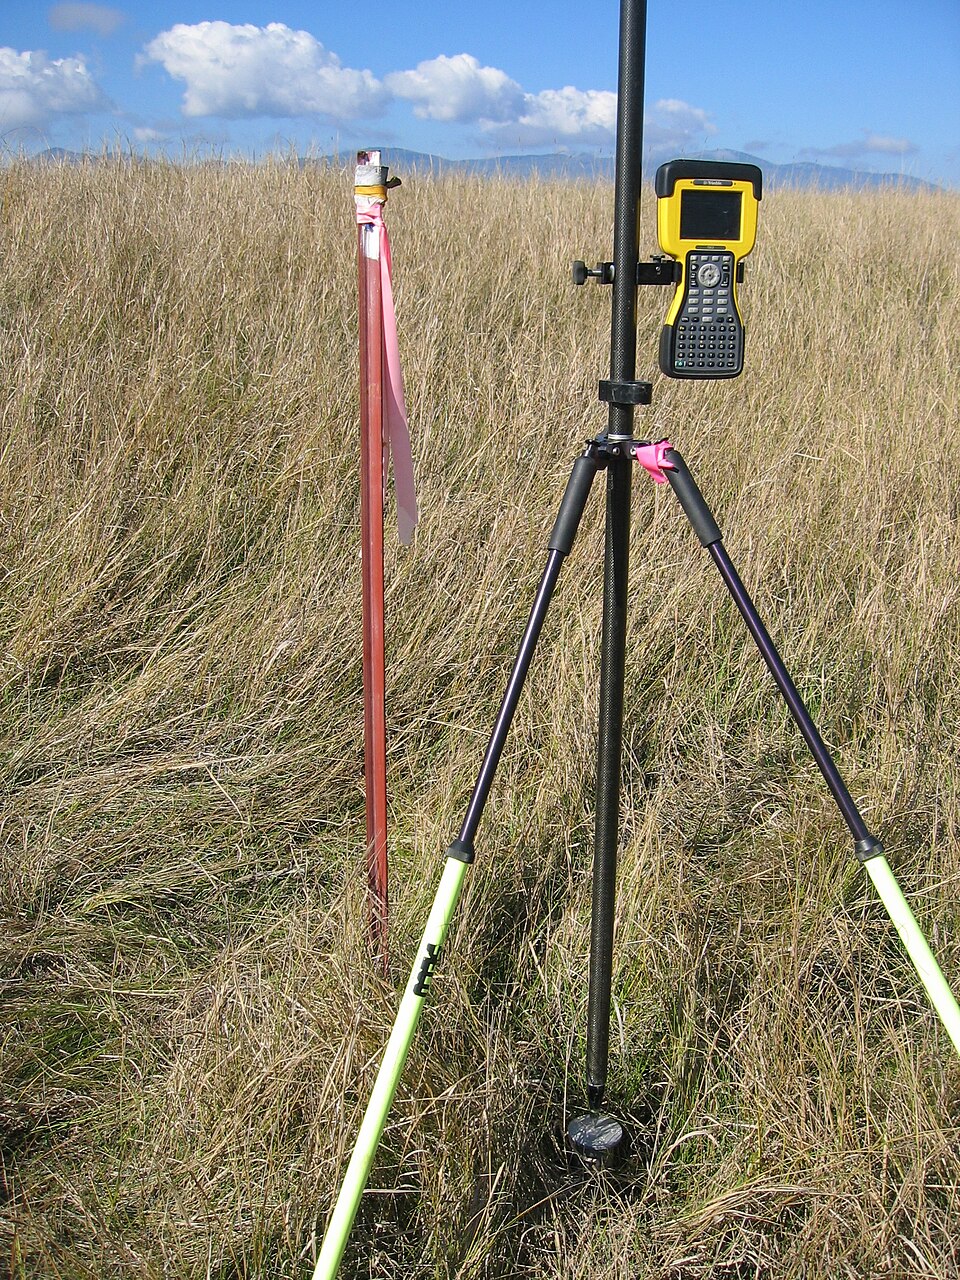
Surveying is a method of collecting highly accurate location data by measuring distances and angles between known points on the ground. Surveyors often use tools like total stations, which send laser signals to a reflective prism to calculate distance and direction, or survey-grade GPS units that use satellite signals with corrections from nearby base stations to achieve centimeter-level accuracy. By combining these measurements with known reference points (control points), surveyors can calculate the precise coordinates of new locations.
4.3.3 Sensors
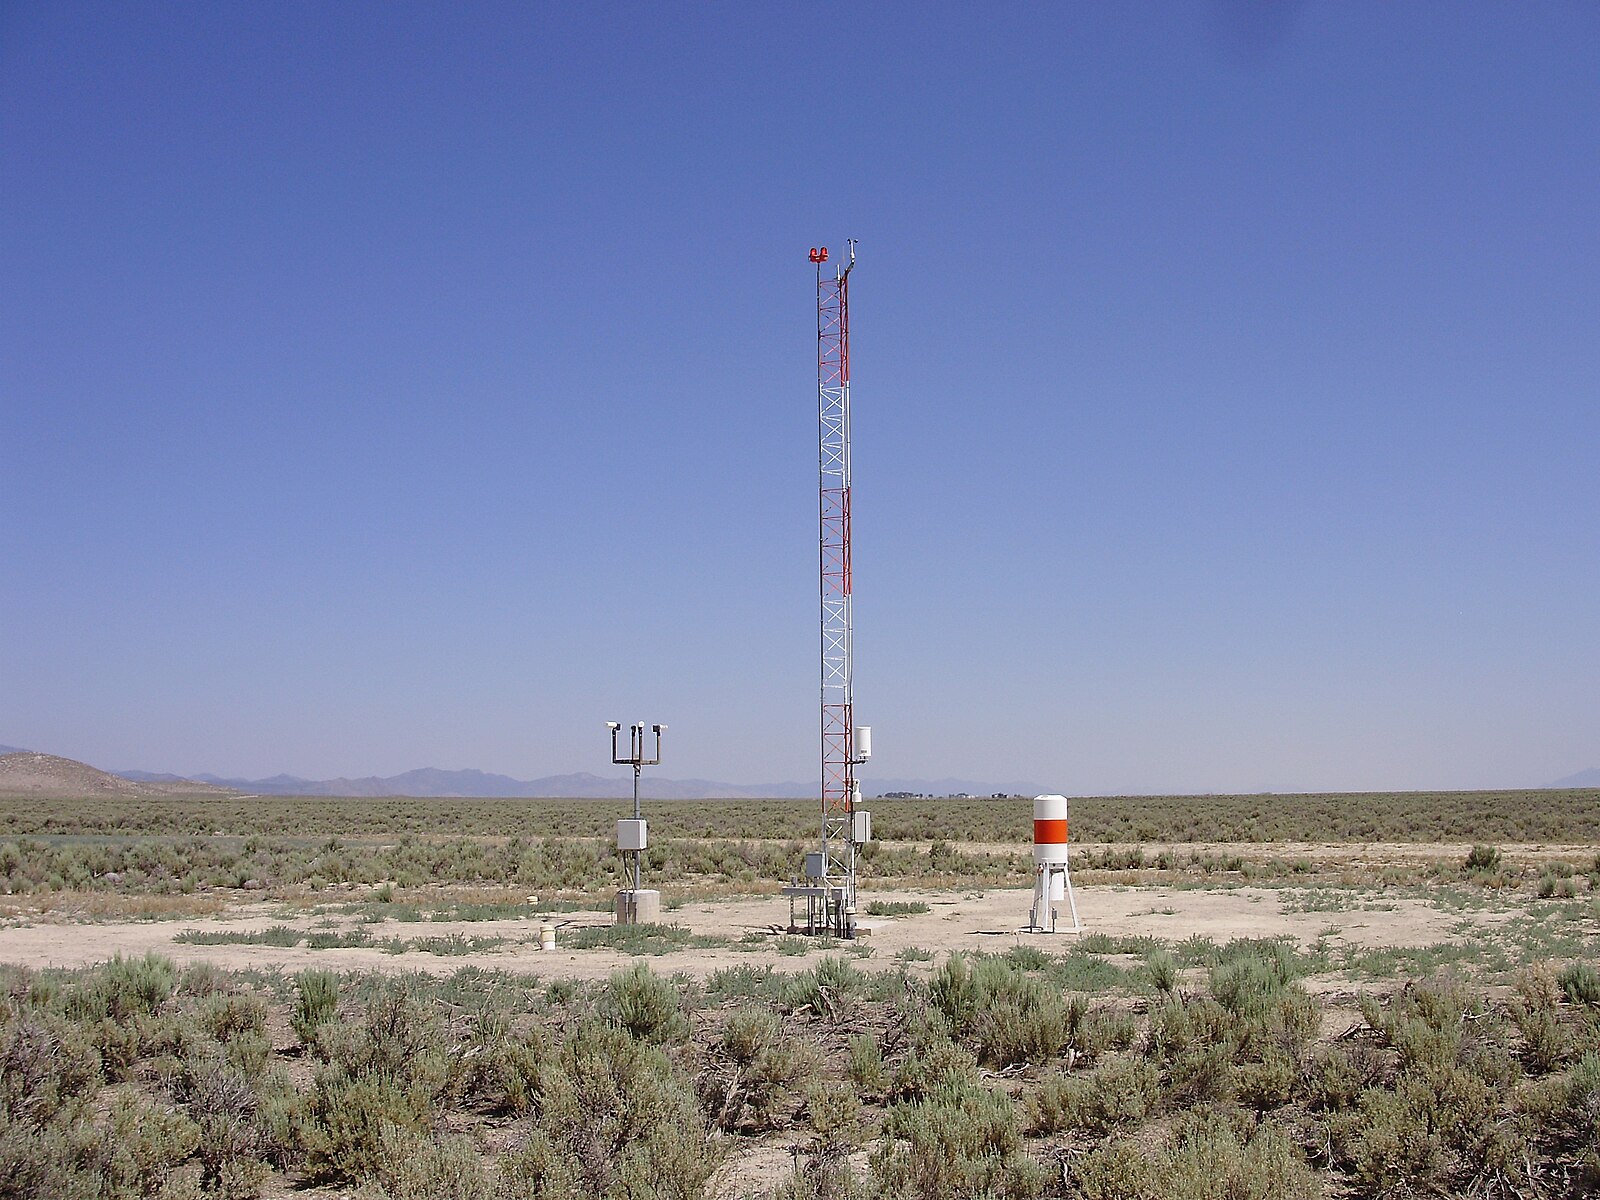
Sensors are placed in fixed locations and are typically used to collect environmental data, such as air pollution, rainfall, or noise levels, over short or extended periods of time. For instance, the national ASOS/AWOS network consists of over 900 stations across the US collecting weather data for over 30 years.
4.3.4 GPS/GNSS
GPS works through trilateration, which determines location by measuring distances from multiple satellites. Each satellite sends a signal with the time it was sent which allows GPS devices on the ground to calculate how far the satellite is from the device location. With signals from at least four satellites, the GPS receiver can determine your exact position on Earth (latitude, longitude, and elevation). GPS uses only the US satellite network, GNSS uses the global network.
4.3.5 Aerial Photography
Images captured from planes or drones are used to document the Earth’s surface
4.3.6 LiDAR (Light Detection and Ranging)
LiDAR uses rapid laser pulses from aircraft or drones to measure the distance to the ground. By calculating how long it takes the light to bounce back, LiDAR can produce highly detailed 3D models.
4.3.7 Photogrammetry
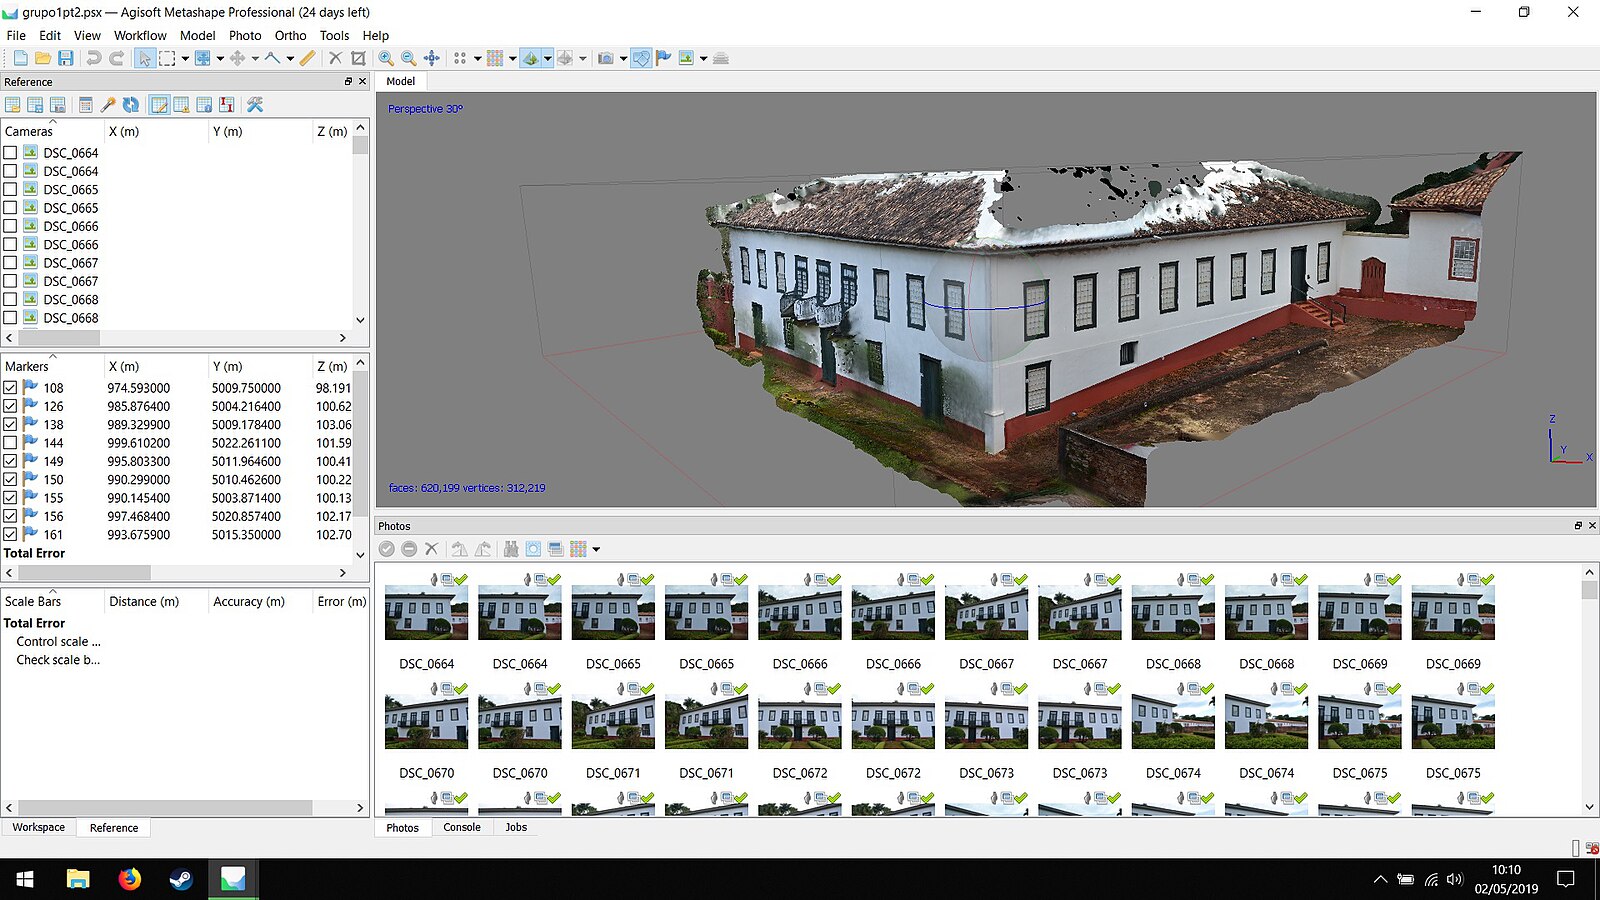
Photogrammetry involves taking many overlapping images of the same area, usually from drones or aircraft, and using software to extract depth, shape, and spatial relationships. It’s commonly used for creating orthophotos, elevation models, and 3D reconstructions.
4.3.8 Census and Surveys
These methods gather demographic, social, and economic data directly from people through questionnaires, interviews, or field observations. The U.S. Census, for example, collects data on population, housing, and income and ties this information to geographic areas for mapping and policy use.
4.3.9 Could Be Spatial Data
Many data sources contain locational information, even if geography is not their primary focus. For example, health records often include patient zip codes, census tracts, or home addresses; tax documents may list property locations or mailing addresses; school enrollment data might be tied to district boundaries or bus routes. While these datasets are not explicitly spatial in origin, they become spatial when analyzed through the lens of geography.
4.4 New Sources of Geographic Data
Collecting geospatial data is now easier than ever. Almost every smartphone has built-in GPS/GNSS. Instead of the ability to collect geospatial data being relatively restricted, it is now possible for nearly anyone to record geographic data. In addition, the rise of online mapping tools like Google Earth has also made geospatial technologies more accessible to the public. As a result, geospatial data collection is no longer confined to experts or specialized equipment, leading to an explosion in the amount of data being generated. These crowdsourced and citizen-generated datasets are now used to support everything from disaster response to urban planning.
Some well-known examples include:
- OpenStreetMap: A free, crowdsourced map of the world built by millions of contributors, widely used in humanitarian efforts and mapping underserved areas.
- Mapillary: A platform where users upload street-level imagery to support navigation, urban development, and computer vision training.
- eBird: A citizen science project where birdwatchers record sightings, contributing to biodiversity monitoring and conservation.
- iNaturalist: A platform where people document observations of plants and animals, helping scientists track species distribution and ecological change.
Crowdsourced or community-collected geospatial data has become an increasingly important way to capture information that is intentionally or unintentionally missed by “authoritative” sources. These grassroots efforts often seek to fill data gaps that disproportionately affect marginalized communities. However, the rise of crowdsourced data has also created tension between official and unofficial sources, which has raised questions about what kinds of data are considered legitimate and who is qualified to collect them.
4.4.1 Case Study
Louisiana Bans Community Air Quality Data
In Louisiana, particularly in the heavily industrialized region known as “Cancer Alley”, residents have been raising concerns about high levels of pollution near industrial facilities. A lack of “authoritative” air pollution data in the area (due to the EPA’s sparse and unevenly distributed monitoring network) meant that community members were unable to validate their concerns. In response, community members began using low-cost air quality sensors to collect their own data.
However, in May 2023, Louisiana passed legislation banning the use of community-collected air quality data in legal or regulatory processes. Lawmakers justified the ban by citing concerns about the accuracy, calibration, and scientific rigor of the sensors used. This decision effectively invalidated grassroots efforts to document environmental health risks and reinforced institutional control over which data “counts.” It also revealed deeper tensions around participatory data, raising questions about who defines data quality, how metadata and standards are used to include or exclude information.
4.5 Metadata
Metadata adds context to a geographic dataset by providing information on how, why, when, and by whom geographic data were collected. Understanding this context is essential for determining whether a dataset can/should be used in a certain analysis. In particular, metadata should answer the following questions:
- What is this data about?
- Where did it come from?
- When was it gathered?
- How is it organized?
- How is it located on earth?
- What features does this data describe and in how much detail?
- What kind of features does this data set describe and in how much detail?
- Who documented the data?
Geospatial metadata is often stored using standardized formats that are structured in XML. There are different metadata standards- such as FGDC (Federal Geographic Data Committee) or ISO 19115- which define consistent ways to create metadata. Metadata is typically embedded within the data file itself (like in a GeoTIFF), stored alongside it as an auxiliary XML file, or managed in a separate metadata catalog or database.
At the same time, metadata often acts as a kind of “gatekeeper” to authoritative spatial data sources, acting as a determining factor to what data is considered trustworthy, usable, or legitimate. A lack of standardized metadata is frequently used as a reason to dismiss crowdsourced or community-collected data, regardless of its relevance or local accuracy. In this way, metadata standards can reinforce institutional control over which data counts and whose knowledge is valued.
4.6 Open Data
Until recently, most geospatial data was difficult for the public to access. Because it was expensive to produce and typically collected by government agencies or private companies, it was generally restricted to official use or available only at a high cost. However, over the past 15 years, there has been a dramatic shift in the amount of free geospatial data available, from both authoritative institutions and grassroots, academic, crowdsourced, or open-source initiatives.. This shift is due not only to the increase in data being collected, but also a growing public demand for data accessibility. The Open Data movement argues that data, especially data collected by government institutions, should be available for anyone to access, use, and share. The movement promotes transparency, accountability, and innovation by reducing barriers to information.
As a result of these factors, public geospatial data portals have emerged at the local, state, and federal levels. In North Carolina, for instance, platforms like NC OneMap and Chapel Hill Open Data Portal make a wide range of GIS data available to the public. These resources have begun to democratize access to spatial information, enabling broader participation in spatial analysis and decision-making.
For critical GIS work, this shift is especially significant. Open data initiatives have helped broaden who can produce and interpret spatial data. However, critical questions remain. Open data is often unevenly distributed, reflecting the priorities, resources, and biases of those who collect and curate it. Increased access does not automatically translate into equity- issues of power, control, and representation continue to shape the geospatial landscape.
4.7 Cooked Data
As D’Ignazio and Klein (2023) write in Data Feminism, “data are not neutral or objective. They are the products of unequal social relations.” Contrary to the “god-trick”, which Haraway (2013) argues assumes that knowledge can be produced by “seeing everywhere from nowhere”, data is shaped by human decisions. There is no such thing as “raw” data, and recognizing that data is “cooked” means recognizing that data is shaped by the tools, priorities, and power structures of its creators. Data Feminism outlines seven principles for rethinking data practices through a lens of justice and equity. These principles offer a framework for critically engaging with geospatial data:
- Examine power: Consider who has the power to produce data and what data is considered useful/useable
- Challenge power: Use data to confront and dismantle unjust systems, not reinforce them
- Elevate emotion and embodiment: Value lived experience and emotional knowledge
- Rethink binaries and hierarchies: Question categorical simplifications (like male/female, urban/rural)
- Embrace pluralism: Include diverse voices, community knowledge, and multiple ways of knowing
- Consider context: Understand that data never exists outside of the context in which it was created
- Make labor visible: Acknowledge the work that goes into data collection, cleaning, analysis, and maintenance.
As we’ll see in the examples below, spatial data (and data generally) often carries embedded assumptions that should be foregrounded in analyses using that data.
4.7.1 Census Race/Ethnicity Categories
Racial and ethnic categories in the U.S. Census don’t just reflect reality, they help construct it. These categories aren’t fixed or neutral; they’ve changed over time in response to political, social, and institutional pressures. Once in place, these classifications are used to enforce laws, allocate resources, and shape policy. In GIS and other forms of spatial analysis, census categories often serve as the foundation for mapping demographic patterns, identifying disparities, and informing decisions. But because these categories are treated as fixed units of analysis, the political and historical choices behind them are often overlooked. Over time, they become treated as objective truths rather than socially constructed decisions shaped by specific contexts.
Read: Strmic-Pawl, Hephzibah V., Brandon A. Jackson, and Steve Garner. “Race counts: racial and ethnic data on the US Census and the implications for tracking inequality.” Sociology of Race and Ethnicity 4, no. 1 (2018): 1-13.
4.7.2 Predictive Policing Algorithms
Predictive policing algorithms use historical crime data to forecast where future crimes might occur. But this data often reflects biased policing practices, not actual patterns of crime. If certain neighborhoods (often Black or brown, low-income communities) were overpoliced in the past, those same areas are flagged again, leading to further policing. This creates a feedback loop where bias in the input data reinforces and reproduces over-policing, which creates additional data bias.
Read: Karppi, Tero. ““The computer said so”: On the ethics, effectiveness, and cultural techniques of predictive policing.” Social media+ society 4, no. 2 (2018): 2056305118768296.
4.8 Ethics and Privacy
The collection and utilization of geospatial data has raised longstanding ethical concerns, particularly around surveillance, privacy, consent, and the uneven distribution of risk. As critical GIS scholars have noted, GIS technologies have their roots in surveillance, and have always been used to serve state and military interests. These origins persist in contemporary applications, where spatial data is often used to track, predict, and regulate human behavior. Scholars (such as Elwood and Leszczynski (2018) and Taylor (2017)) have emphasized that these practices risk reinforcing structural inequities, as data infrastructures disproportionately expose marginalized communities to surveillance, profiling, or exclusion.
In the era of big data, privacy concerns have deepened. Vast quantities of location data are now collected passively through smartphones, apps, wearable devices, and social media platforms. These data are often repurposed for uses never disclosed to the individuals they describe and users are often unaware that their data is being collected. Even when anonymized, spatial data can often be de-anonymized, especially when combined with other datasets. Locational data is inherently sensitive because it reveals information about personal movement.
4.9 Critical questions to ask about your data
- Who/what is missing from this data?
- Who decided what to measure and how to measure it?
- How were the data collected?
- What assumptions are built into the data structure?
- What is the purpose of this data- and who benefits?
- What impacts might my use of the data have?
4.10 Data Exploration Exercise
Overview:
There is a huge amount of geographic data from both “authoritative” and non-authoritative sources that is available to the public for free online. This was not the case 15 years ago and the growth of open data has been transformative for GIS practitioners.
Finding, downloading, and cleaning spatial data accounts for the most time and effort in an analysis workflow. For that reason, most of the data that you use in this class will be pre-downloaded and pre-processed. However, it is still important to be familiar with the data access workflow. In this activity, you will visit some of the well-known spatial data providers, get familiar with metadata standards, and practice downloading spatial data.
Instructions:
Visit each of the following data providers and use the prompt to find appropriate spatial data. When you have found a dataset, answer the following questions:
- Is this authoritative data? How can I tell?
- Can I easily download the data? What file type does it download as?
- Is there metadata associated with this dataset? What information does the metadata give me that I wouldn’t know otherwise?
- What critical questions can I answer about this data?
NC OneMap is North Carolina’s geospatial open data portal. Find a dataset that would help you answer a spatial research question about natural disaster risk and explore the dataset in the data viewer. Hint for finding metadata: click “I want to use this”.
Find streetview data for one of the concert venues in Raleigh, NC.
USGS National Map is USGS’s open data portal. Find a dataset that will give you information about elevation in Orange County, NC.
Find precipitation data for Orange County during Tropical Storm Chantal.
Find a dataset that would help propose the location of a new hospital (make sure to filter only to geospatial data).
Explore the US distribution of any species of hummingbird
Find an area in the US with poor air quality right now
US Census Bureau Population Data
Find data about educational attainment in North Carolina


